Open source home server dashboard
A small dashboard for a small server.
armdash is a single static binary that shows what your home server and your smart home are doing. Every number is read from Prometheus, so every number on screen has history behind it.
Why not just Grafana?
Grafana is the obvious answer and a good one. But it is a large thing to run permanently on a 12 W board, it is not packaged for aarch64 in Arch Linux ARM or the AUR, and most of it goes unused when all you want is a handful of charts and a plan of your flat.
armdash is the small version of that. Go with the standard library only, server-rendered pages with htmx, Bulma and uPlot embedded in the binary. Nothing to install next to it, nothing to update behind its back.
- Installone static binary
- Databasenone, Prometheus keeps history
- Runtime dependenciesnone
- Go modulesstandard library only
- Node toolchainnever
- Built foralways-on ARM boards
- Also runs onany amd64 Linux box
What it shows
One tab per system. Each one is compiled in and switched on or off in the configuration.
Server metrics
CPU, memory, filesystems, temperatures, load and uptime from node_exporter. An overview of the current values and a chart per metric, from the last hour to the last year. The thermals chart names its lines, so a warm board tells you which part is warm.
FRITZ!Box smart home
Smart plug power and energy, room temperatures, humidity, thermostat
setpoints and battery levels. armdash talks to the box itself, so there is no
separate exporter to run, and republishes every reading at
/metrics for Prometheus to keep.
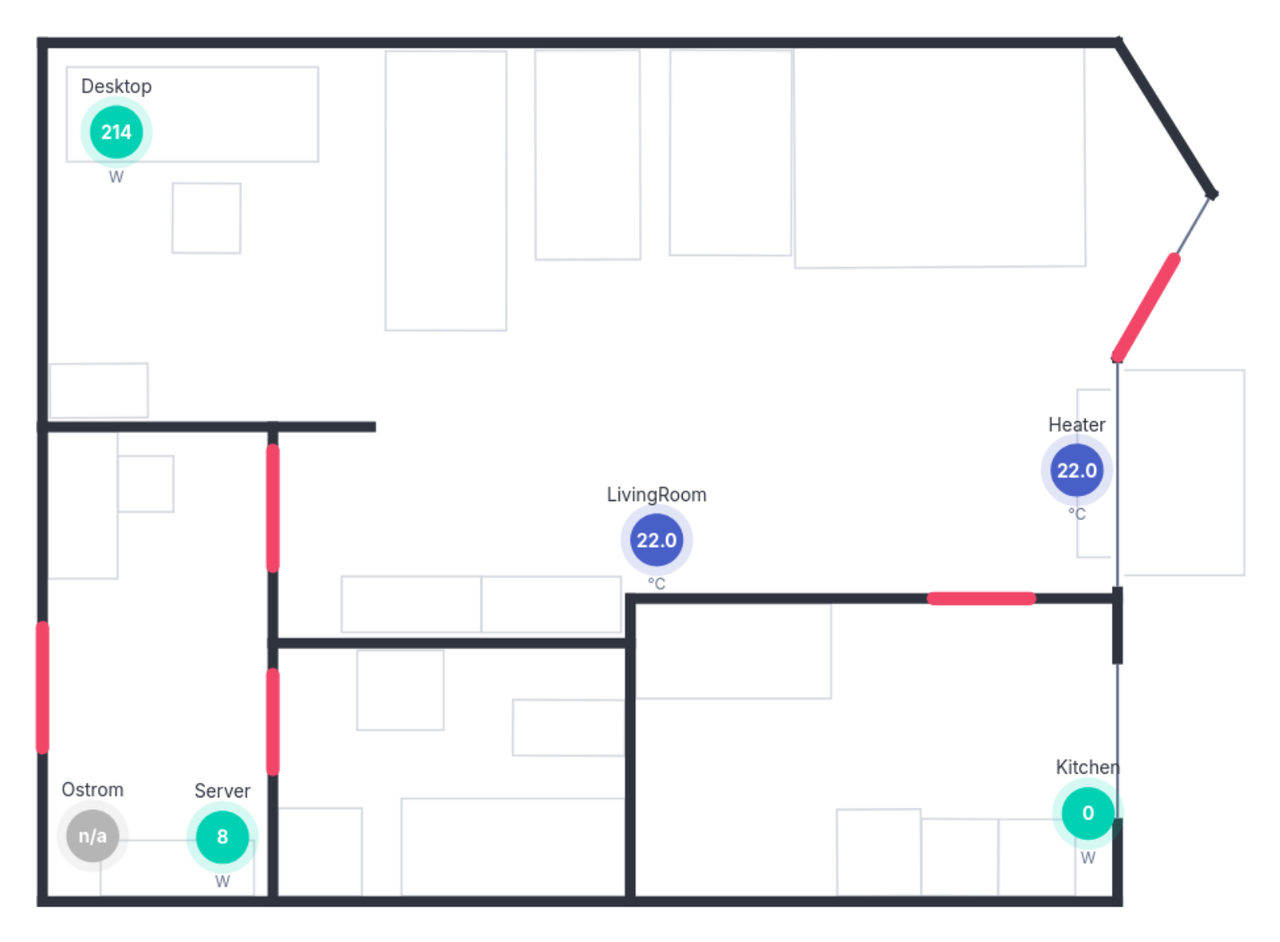
Your flat, to scale
Upload the .sh3d file straight from SweetHome3D: walls, rooms,
doors, windows and furniture are drawn from it. An SVG or a photo of the plan
works too. Press Edit and drag each sensor to where it sits.
The rest of the server
Put your wiki, a Grafana or the router in the navbar. Each one opens in a frame, through the built-in reverse proxy, or in a new tab, from a few lines of configuration.
Read-only settings
Env files and the environment, nothing else. The Settings page shows every value and where it came from, but nothing writes it back. A config change is an edit to a file, never a click.
Open to look, locked to change
The dashboards stay open to your LAN, like a display on the wall. Uploading a plan, placing devices and opening Settings need the one owner login: a PBKDF2 hash, server-side sessions and failed logins limited per address.
How it fits together
armdash keeps no history of its own. Prometheus scrapes node_exporter and
armdash's /metrics, and armdash reads Prometheus back to draw the
pages. Both exporters are packaged for aarch64, so none of it needs containers.
A Compose stack is there if you prefer them.
Install
Every release ships static arm64 and amd64 binaries plus .deb,
.rpm and Arch packages, all built from the same commit.
# or dpkg -i / rpm -i
$ sudo pacman -U armdash_*_linux_arm64.pkg.tar.zst

# prints the two login lines for the env file
$ armdash passwd

# address, Prometheus, FRITZ!Box, login
$ sudoedit /etc/armdash/armdash.env
$ sudo systemctl enable --now armdash
# /etc/armdash/armdash.env
AD_CORE_ADDR=:80
AD_CORE_PROMETHEUS_URL=http://127.0.0.1:9090
AD_SYSTEM_FRITZHOME_URL=http://fritz.box
The package brings a hardened systemd unit. It runs as its own unprivileged user on a read-only filesystem, with one writable directory for the uploaded floor plan and device positions. Ports 80 and 443 work without root.
Point it at a certificate and it serves HTTPS, with the plain port redirecting there.
armdash is a LAN tool. Keep it on your home network and do not forward it to the internet.